Improve SEO through Niche Infographics
In this tutorial, we’ll learn about the concept of infographics, how they affect SEO, and how to implement a linkbuilding strategy for your specific niche.
What is an Infographic?
An infographic is a visual representation of information and data.
It’s often used to catch the eye of volatile users that normally wouldn’t be interested in the information if not presented in such an eye-catching way.
Infographics are great for:
- Presenting content, information, & data visually
- Promoting quick & easy sharing
- Targeting a specific, niche audience
How to Make an Infographic
Creating an infographic isn’t an easy task, but we can at least outline the process to help you understand where to start and the next steps after that.
Step One: Brainstorm
As with most things, an infographic starts with a big idea. Bring in as many people as you can on this initial brainstorming session because once you get going, it won’t be fun to have to start all over.
The main focus of this step should be narrowing down the topic and your target audience. What do you want to say and who do you want to say it to?
We’ll talk more about finding a target audience later, but it’s arguably the most important step in the entire process, so really spend some time on this.
Step Two: Research
An infographic is only as good as the information that it shares, and, in all honesty, most infographics are just an accumulation of information from multiple different sources.
Here are a few things to keep in mind while working your way through this step:
- Include your sources in the infographic
- Short statistics with surprising percentages are the best
- As you’re researching, think of ways that you can visualize the information
Step Three: Concept
Okay, it’s time to put on your marketing hat if you’re not already wearing it. You have a target audience and information that you want to share with that target audience. You need to think of the best way to share this with them visually.
While this step is going to change drastically based on a multitude of factors, here are some tips that may help you out:
- Keep it simple – Even though your target audience should be interested in the topic almost right away (if you chose the audience and topic correctly), you still need to assume that they know almost nothing going in.
- Decide on the sizing of the information – We’ll go into design soon, but deciding the size and prominence of the information belongs in the concepting phase.
Step Four: Design
It’s time to pass the concept off to the designer for the first draft of your infographic. If you’re the designer, even better because you’ll already have an idea in your head of what you want and you’ll be able to skip the step of communicating that somebody.
Depending on your relationship with your designer, it’s normally a good idea to at least CC them in on any emails that you have with your team about the infographic. This way, they can follow along from the beginning, gathering information about the project and taking more ownership of it rather than just another design project that they need to get through.
The name of the game in this phase is to be as clear as possible with your designer. Hopefully, you already know what you want, so you’re about to describe it as clearly as possible. Some things that you’ll want to explain may be:
- Color scheme
- Font(s)
- Overall shape (rectangular, square, circular, etc.)
- Background texture or image
- Illustration or icon style
Step Five: Revision
It’s not very likely that the first revision of the infographic is going to be perfect, and that’s to-be-expected. It’s exciting to finally see your idea brought to life, but it’s important to be critical of the first edition in particular. This is especially true for infographics because once you’ve started your outreach and gotten embeds posted on other sites, you won’t be able to change what they have. So, you need to ensure that the first one that you go live with is absolutely perfect.
Go over the design multiple times yourself and share it with anyone and everyone that you can to get as many opinions as possible. Send all of this feedback to your designer and await the second version.
Rinse and repeat this process as long as it takes until you get the perfect infographic that you’ve been dreaming of.
Step Six: Publication
It’s finally time to share your beloved creation with the world. While it may not sound entirely glamorous, we recommend posting your infographic as a blog post on your website. It’s a quick and easy way to host the image and apply any size/style changes that you need.
It also grants you the ability to post the ever-so-important embed code prominently under the image for easy sharing and precious links. More on this later.
How to Successfully Outreach for Your Infographic
Once you’ve determined the target audience that you’re trying to connect with, find VIPs or thought-leaders in the space. You can do this by looking into who has blogs or articles written about it online or check out who’s talking about it on social media.
Whoever you find, however, needs to have their own site that they would be able to post your infographic to or all of your work was for naught.
Here are some tips to reach out to these VIPS:
Engage with their content early and often
Virtually everyone is more likely to respond to a request from someone if they already know. Establishing a relationship before to keep yourself from becoming the cold email everyone seems to hate.
The best ways to start engaging with someone before reaching out to them about your infographic is to engage with them on their blog posts or social media. Be sure to do this over a period of time, though. If you comment on all of their old tweets in one day and then Direct Message them, they’ll probably be a bit freaked out by you.
Take it slow and establish a real relationship. Meeting new people is fun!
Be direct with your ask
This prominent person probably gets asked for links all the time, so don’t try to sneak it into the conversation.
Be up-front and direct about the fact that you’d like a link to your infographic. Explain how it is valuable and how you think the VIPs users would benefit from it.
Make it quick
Don’t send this person an essay before making your ask. They’re busy and will appreciate a short, concise email or message so that they can move on with the rest of their work.
How Creating an Infographic Affects Your Site’s SEO
When it comes to creating infographics, linkbuilding is the name of the game. The goal is to create a useful infographic that people will then embed on their own site, linking back to you.
When it comes to the indexing of your site, search engine spiders can’t read the text or interpret the visuals of the infographic because it’s saved as an image. They’re stuck with the file name, alt tag, and title tag to figure out what the image is about. So, your infographic won’t be gaining you many results in SERPs, but it will get you a chance at links which is what you’re looking for here.
Add an Embed Code Under Your Infographic
An embed code is HTML that the user can copy from your website to paste the infographic onto their own website. This embed code should include , , , and . Here’s an example:
<br/><br/>
Some of Our Favorites
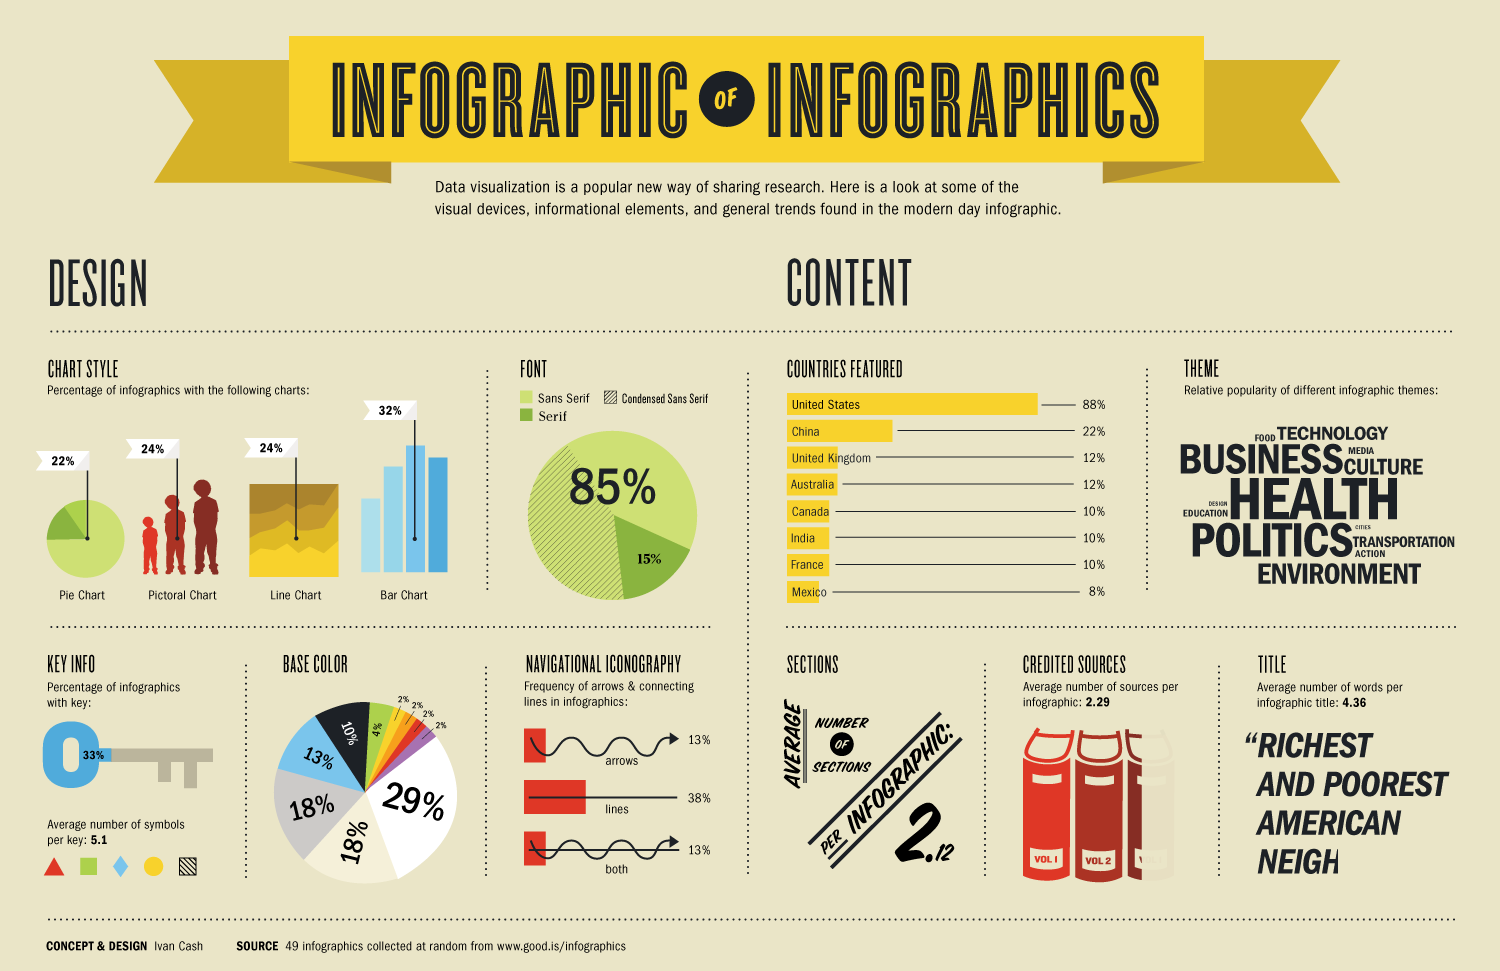
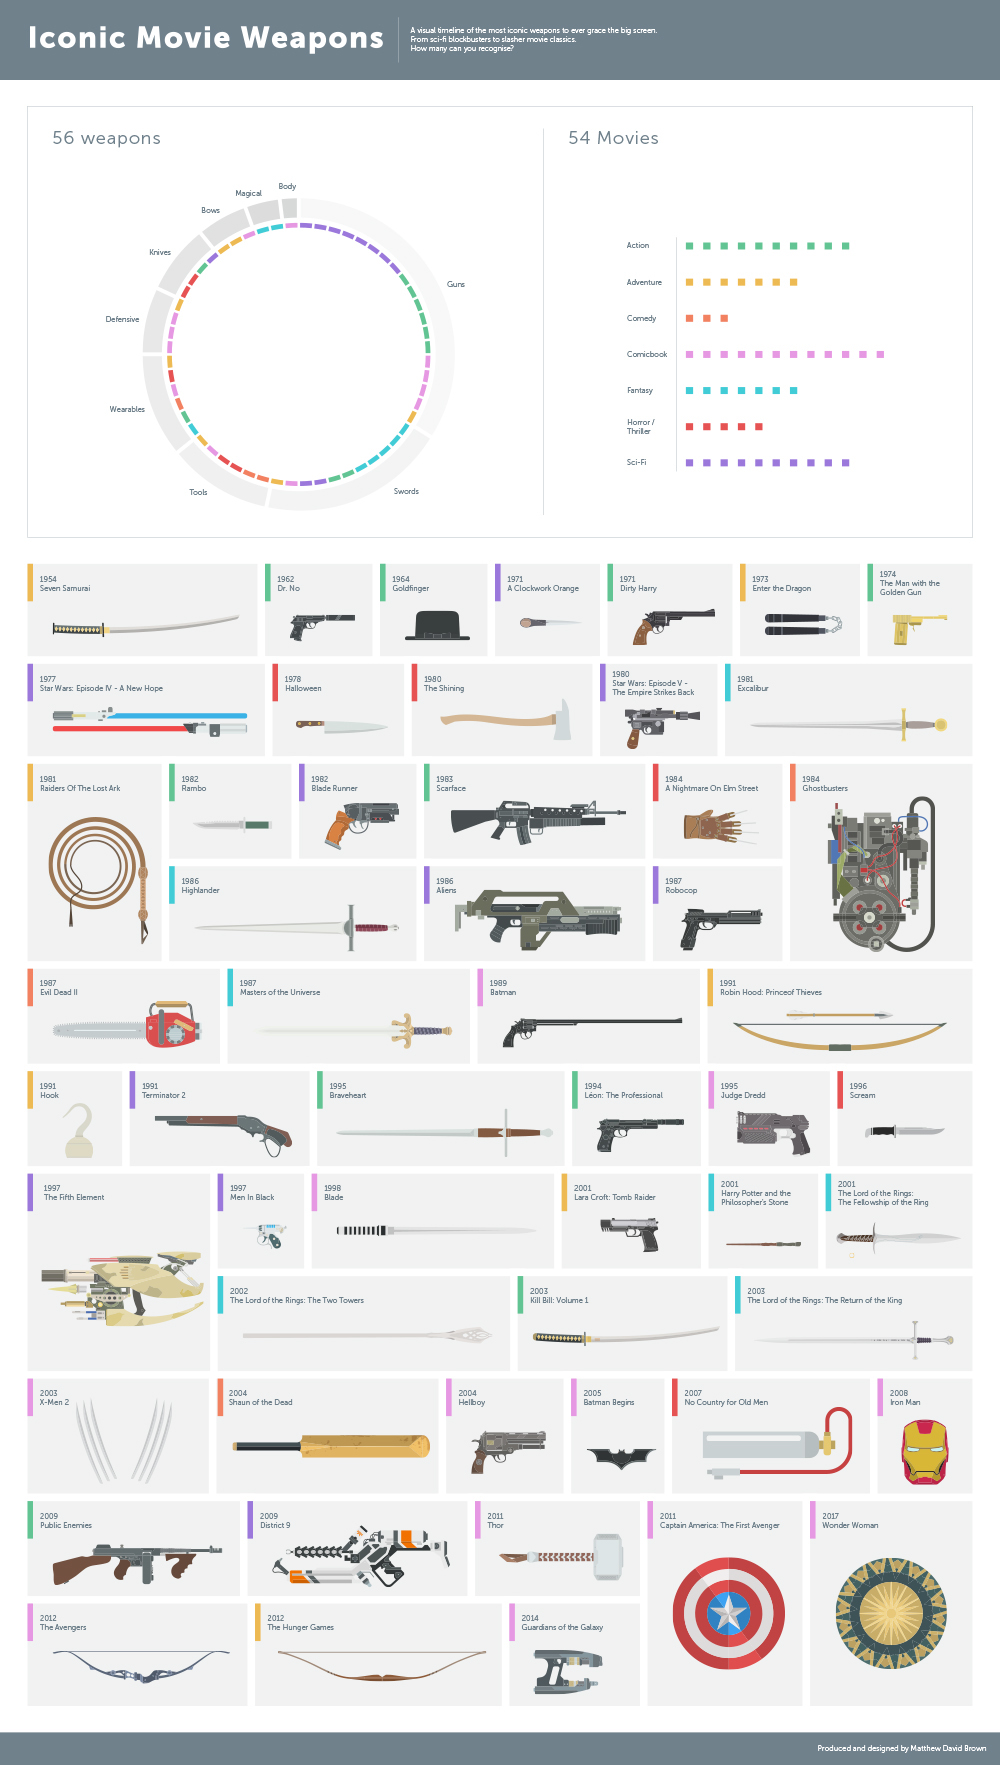
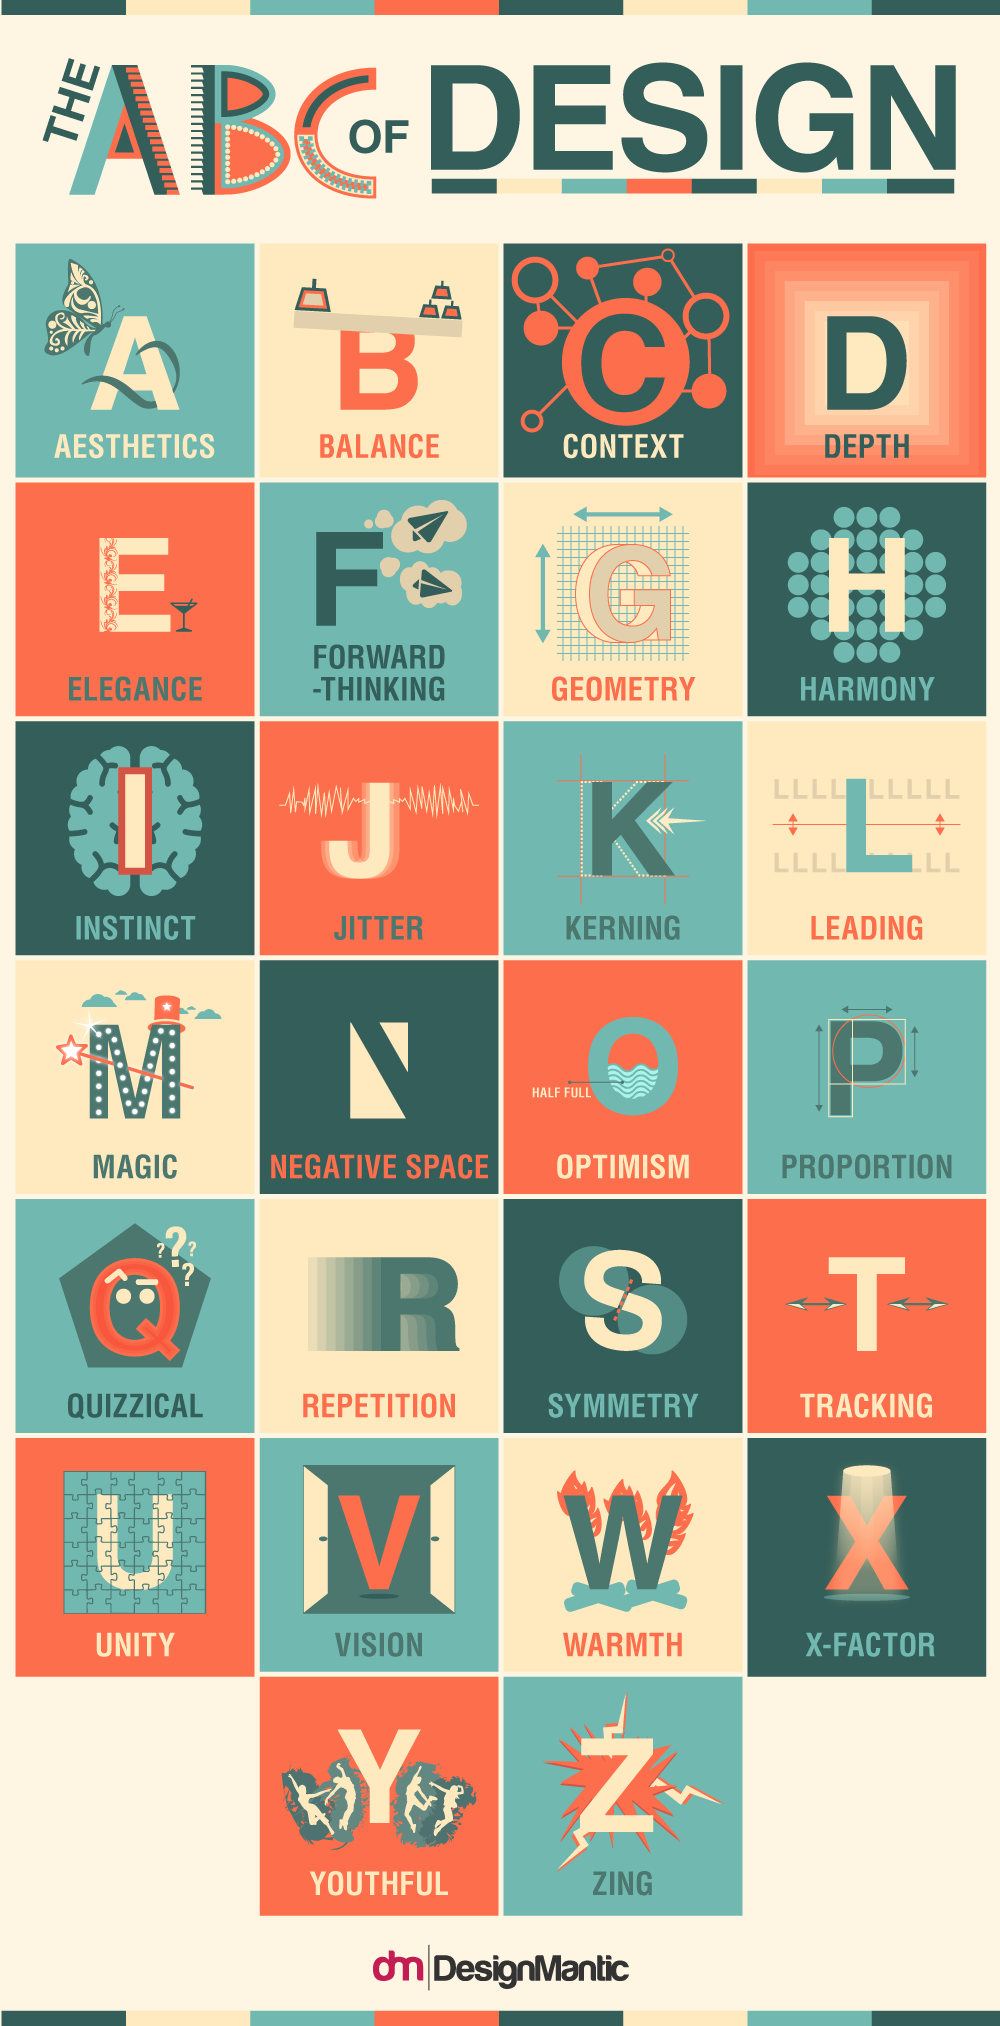
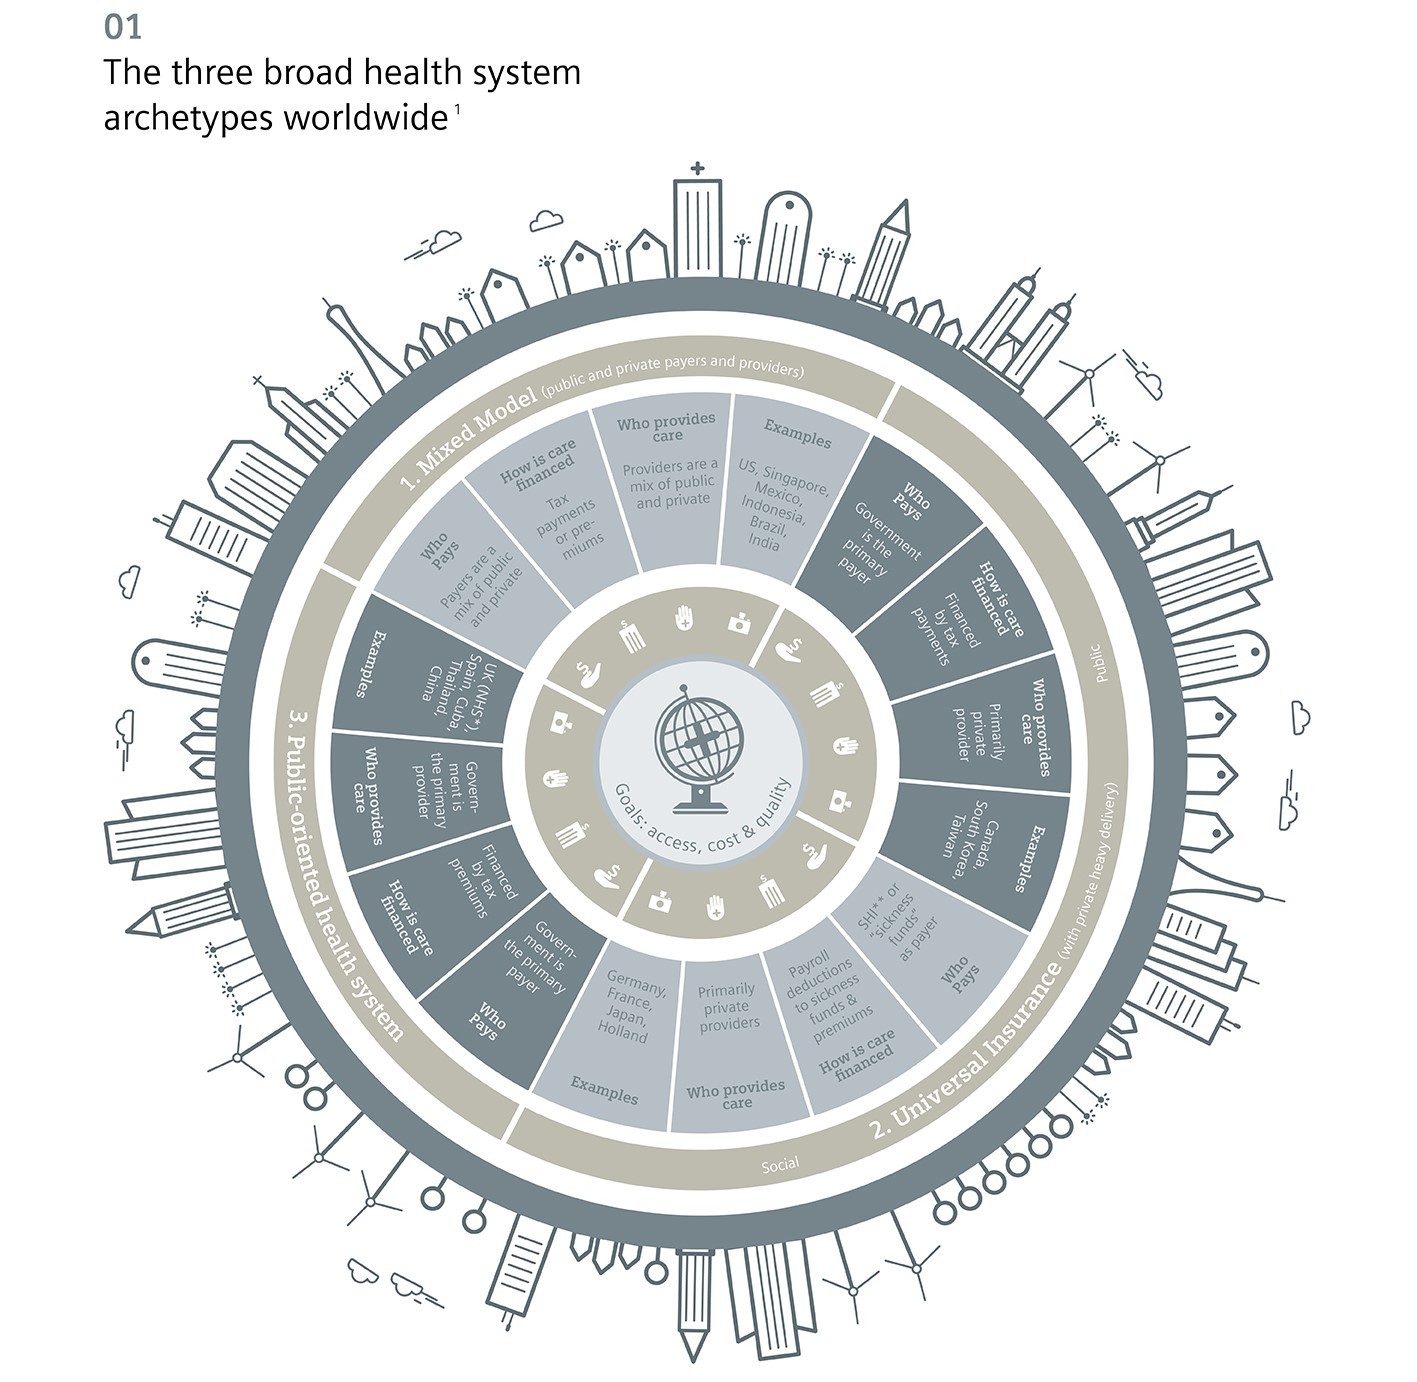
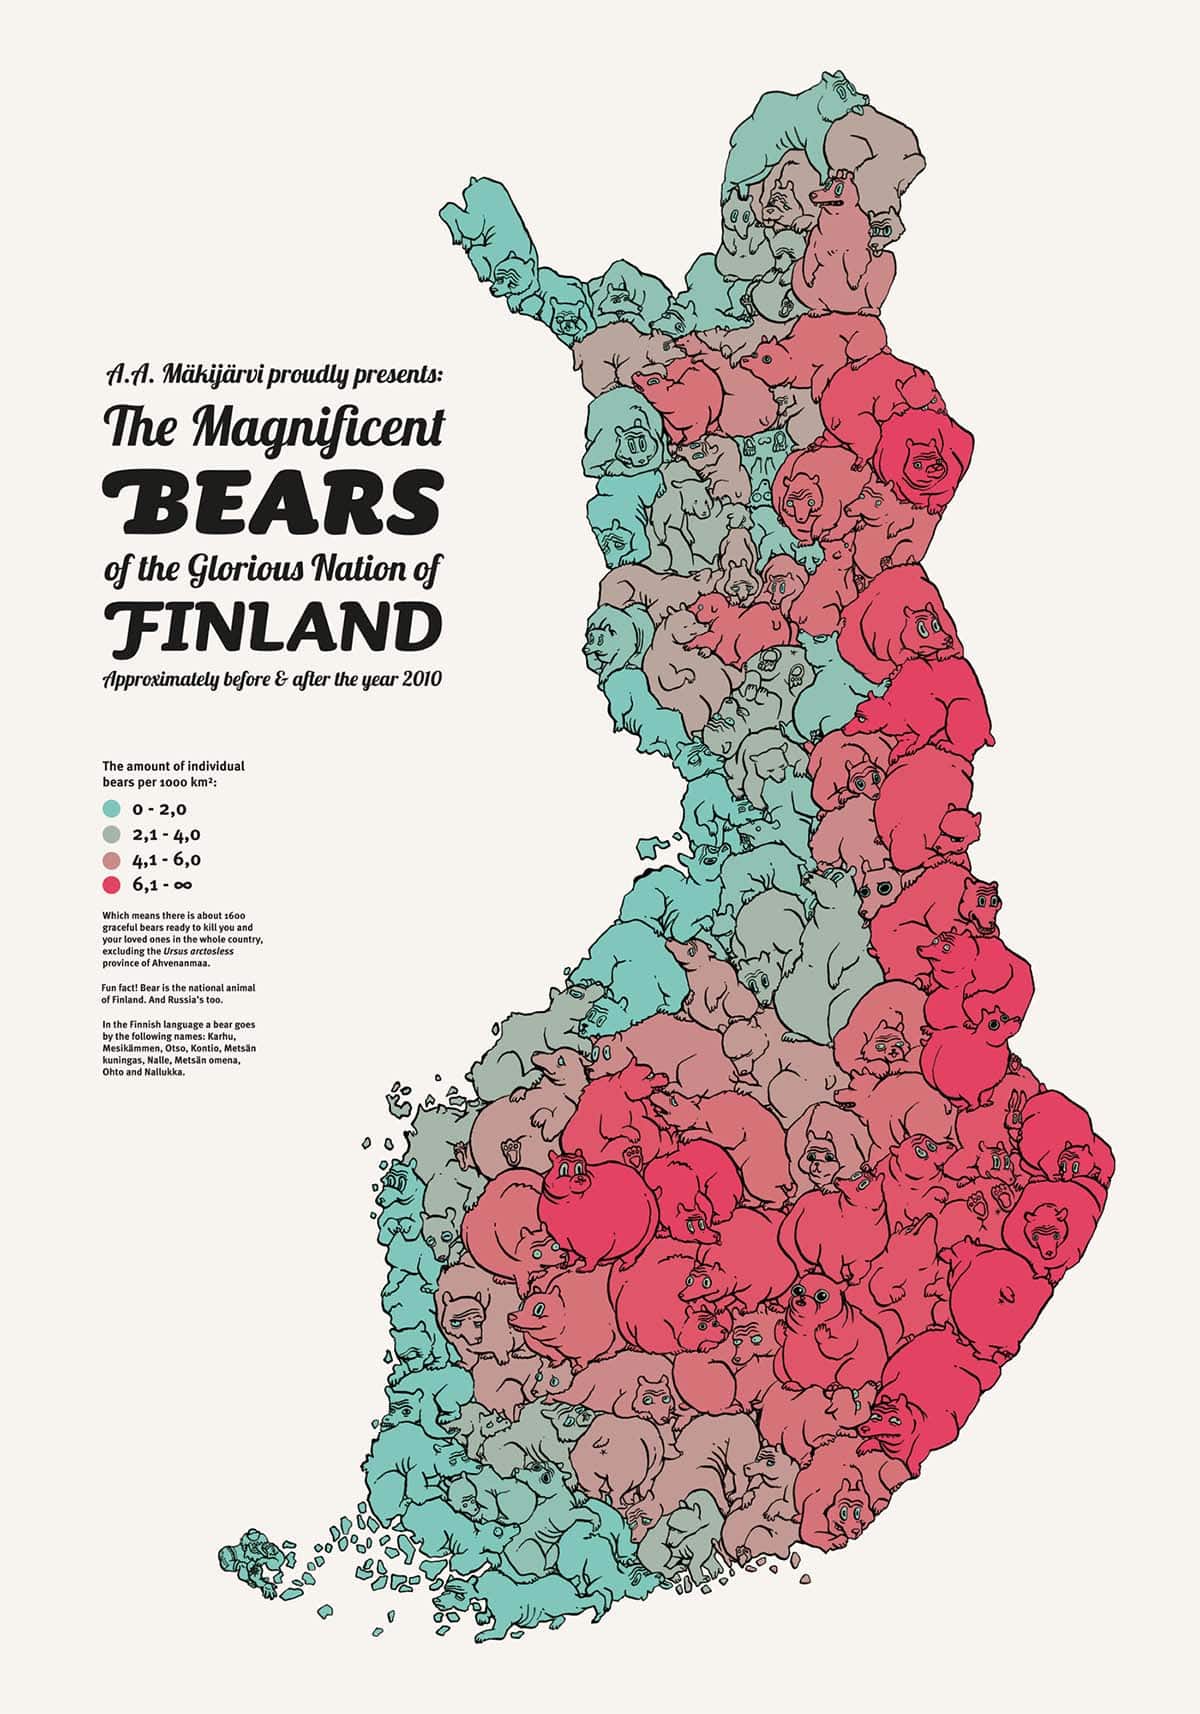
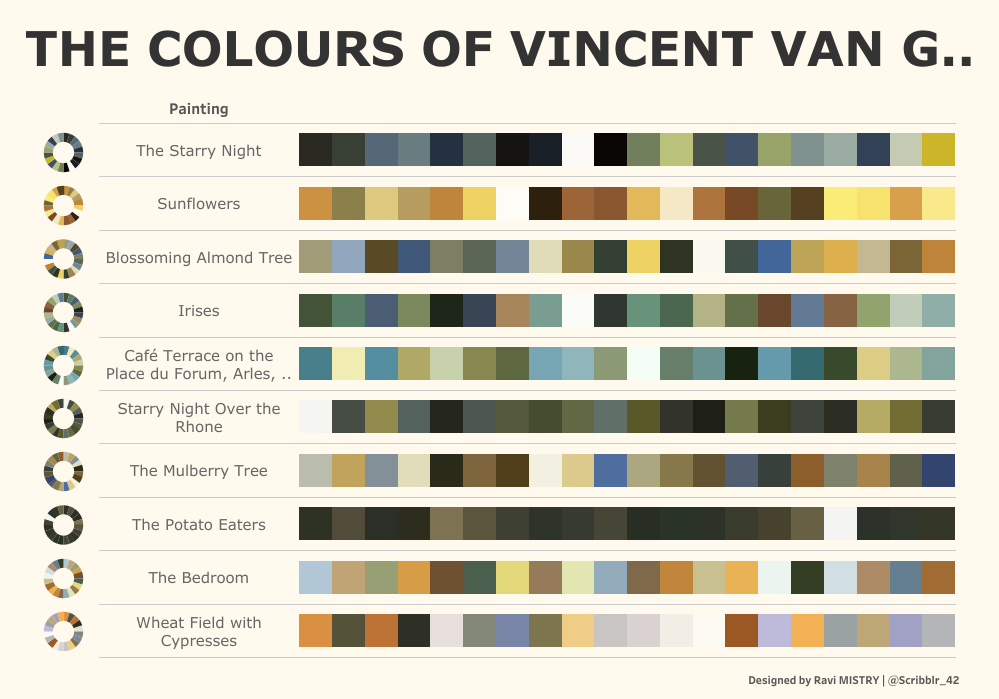
Below are some of our favorite infographics that we could find online. Hopefully, they give you some sort of inspiration.
